





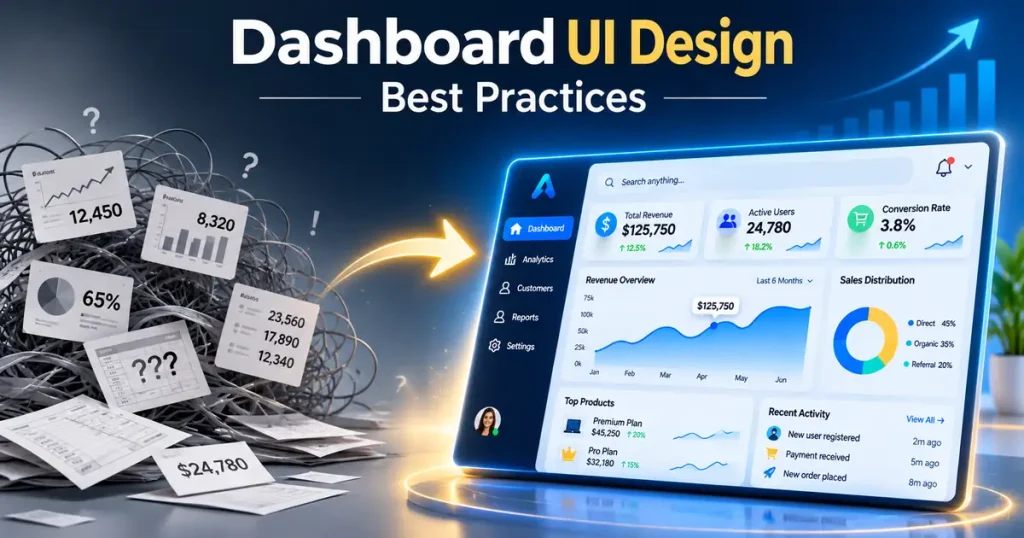
Good dashboard UI design puts the three to five numbers a user checks most at the top of the screen, shows each one with a chart the eye reads accurately (bars and lines, rarely pies), and lets the user act on what they see within one or two clicks. Everything else on the page, from color to filters to loading states, exists to support that. If someone opens your dashboard and can’t tell within a few seconds whether things are on track, the design needs work.
This guide is for SaaS founders, product managers, and CTOs who are building a new dashboard or rebuilding one that users have stopped trusting. We cover which type of dashboard you need, how to lay out the screen, which charts to pick for which question, how to handle accessibility and speed, and the mistakes that show up again and again in products that come to us for a redesign.
At Golden Info Systems, we design and build dashboards for SaaS products and enterprise software from our offices in Dhaka. The practices below come from that work and from published research, which we link wherever it applies.
1. What Dashboard UI Design Is and Why It Matters for Your Business
A dashboard is one screen that answers one main question for one kind of user. Usually the question is some version of “How are things going, and what needs my attention right now?” Dashboard UI design is the work of deciding what goes on that screen, how it’s arranged, and how it behaves when data changes or a user clicks, filters, or drills down.
In most SaaS products the dashboard is the first screen after login. Users see it every day, so it shapes their opinion of the whole product more than any marketing page does. A cluttered or slow dashboard makes a capable product feel broken.
Operational vs analytical dashboards
The Nielsen Norman Group, in its article on making dashboard charts easier to understand, separates dashboards into two types. Operational dashboards support time-sensitive action: a support queue, a delivery tracker, a server status board. Analytical dashboards support slower decisions, such as a monthly revenue review or a cohort retention report.
The split matters because each type needs a different layout. An operational screen needs big status indicators, alerts, and auto-refresh. An analytical one can hold more charts, more filters, and comparison periods, because the user has time to read it.
Many teams also build a third, strategic view for executives: a handful of KPIs with targets and trend lines, refreshed daily or weekly. Mixing all three on one screen is the most common reason a dashboard feels crowded.
Why SaaS dashboard design affects retention
In a subscription product, the dashboard is where customers see the value they’re paying for. If a marketing team logs into your analytics tool and can’t find last week’s campaign results in under a minute, they’ll export the data to a spreadsheet instead. After a few weeks of that, your product becomes a data pipe, and data pipes are easy to replace at renewal time.
Good SaaS dashboard design shows value without effort. It answers the customer’s main question on the first screen, uses their own language for metrics, and points to the next useful action (a report to schedule, an alert to set up, an integration to connect).
Why enterprise UX design is a different problem
Enterprise dashboards serve many roles with different permissions: a branch manager, a regional head, a finance officer, an auditor. They pull data from several systems that don’t always agree, and people use them for hours at a time as part of their job.
That changes the priorities. Enterprise UX design for dashboards puts more weight on data density, keyboard shortcuts, saved views, export, and audit trails. It also has to account for training cost; a screen that 400 staff must learn has a real price attached to every confusing control.
2. Key Principles of Effective Dashboard UI Design
These principles apply to almost any dashboard. We’ve ordered them roughly by how much damage it does to skip each one.
Start from user questions, not from available data
The fastest way to build a bad dashboard is to open the database and chart every table. Start instead by writing down who uses the screen and the five or so questions they need answered. A sales manager might ask: Are we on pace for the monthly target? Which reps are behind? Which deals are stuck?
Each question becomes one widget. Data that doesn’t answer a listed question goes to a report page, not the dashboard.
Build a clear visual hierarchy
Users scan a screen in a fairly predictable order, starting at the top left. Put the most important number there. A common and effective dashboard UI design pattern is:
- A row of four to six KPI cards across the top, each with the current value, a comparison (vs last period or vs target), and a small trend line.
- One or two large charts below that show the main trend or breakdown.
- Detail tables and secondary charts lower down, for users who want to dig in.
- Global filters (date range, region, team) in one consistent place, usually top right or in a left rail.
Size signals importance. If every card is the same size and weight, nothing stands out, and the user has to read everything to find the one problem.
Choose charts the eye reads accurately
This is where data visualization UI decisions do the most good or harm. NN/g’s research notes that people perceive length and 2D position more accurately than area, angle, or color intensity, which is why bar charts and line charts work so well for quantitative comparison. Pie charts, donut charts, and radial gauges rely on angle and area, so users misjudge the values.
In practice, that means bars for comparing categories, lines for trends over time, and bullet charts (a linear bar against a target marker) instead of speedometer gauges. Use a plain number with a delta when the number itself is the answer. Avoid 3D charts entirely; NN/g states plainly that 3D makes a chart harder to read quickly and accurately.
Use color with restraint and never alone
In dashboard UI design, color should carry meaning. Pick one neutral palette for normal data and reserve strong colors (red, amber, green) for status. NN/g advises against using color to show magnitude and cites color blindness rates of roughly 8% of men and 0.5% of women.
Two WCAG rules apply directly. Success Criterion 1.4.1 says color must not be the only visual means of conveying information, so a red status needs an icon or label too. Success Criterion 1.4.11 requires a 3:1 contrast ratio for graphical objects, which includes each line in a line graph against its background. Direct labels on chart lines also help, since they remove the need to match colors against a legend.
Design for density and roles
Consumer apps can afford white space; an operations team watching 200 shipments cannot. Good enterprise UX design offers a compact table density option, sticky headers, column sorting, and saved views so each user returns to the filters they actually use. Role-based layouts are worth the effort: a finance officer and a warehouse supervisor shouldn’t see the same default screen just because they share a login system.
Make it fast
A dashboard that takes eight seconds to load gets opened less often. Google’s Interaction to Next Paint (INP) guidance treats 200 milliseconds or less as good responsiveness, measured at the 75th percentile of page loads. Filters and date pickers on a dashboard are exactly the kind of interactions INP measures.
Practical ways to stay fast:
- Pre-aggregate metrics on the server (daily or hourly rollups) instead of crunching raw rows in the browser.
- Load the KPI row first and lazy-load charts lower on the page.
- Show skeleton placeholders so the layout doesn’t jump when data arrives.
- Cache repeat queries and show a “last updated” time so users know how fresh the data is.
Design every state, including the empty ones
Designers often mock up a dashboard full of perfect data. Real users see empty accounts, partial data, failed API calls, and numbers that are zero for legitimate reasons. Each widget needs a designed empty state (with a hint on how to get data in), a loading state, an error state with a retry option, and a clear way to show “no data for this period” that doesn’t look like a bug.
3. Choosing the Right Chart and Layout: Comparison Tables
In dashboard UI design, most chart mistakes come from picking the chart before the question. The table below maps common dashboard questions to chart types. It’s the reference we use when reviewing a data visualization UI with a client.
| User’s question | Best chart | Avoid | Why |
|---|---|---|---|
| How is this metric trending over time? | Line chart (or area chart for one series) | Bar chart with 30+ thin bars | Lines show slope and direction clearly |
| Which category is biggest? | Horizontal bar chart, sorted | Pie or donut chart | Length is read more accurately than angle |
| Are we on track for the target? | Bullet chart or progress bar with target marker | Speedometer gauge | Linear scale, less space, easier comparison |
| What share does each part hold? | Stacked bar (100%) or simple table with percentages | Pie with 6+ slices | Small slices become unreadable |
| What is the single most important number? | KPI card with value, delta, and sparkline | Big chart for one number | The number is the answer |
| How are values spread out? | Histogram or box plot | Average alone | An average hides outliers |
| Is there a relationship between two metrics? | Scatter plot | Two separate line charts | Position on two axes shows correlation |
| Where is it happening? | Choropleth map with a ranked list beside it | Map alone | Maps make small regions hard to compare |
| Who or what is top or bottom? | Ranked table with inline bars | Word cloud | Exact order and values matter |
SaaS products and internal enterprise systems also differ in what the dashboard needs to do. This second table sums up the main contrasts.
| Aspect | SaaS dashboard design | Enterprise dashboard design |
|---|---|---|
| Main user | Customer, often non-technical | Employee in a defined role |
| Goal | Show product value fast, drive adoption | Support daily decisions and operations |
| Data sources | Mostly your own product data | Several internal systems (ERP, CRM, HR, finance) |
| Customization | Light: date ranges, a few saved views | Heavy: role-based layouts, permissions, exports |
| Density | Moderate, with room for guidance | High, built for long sessions |
| Onboarding | Empty states and in-app hints matter most | Training material and consistency matter most |
| Success metric | Logins, feature adoption, renewals | Task time, error rate, report accuracy |
4. Step-by-Step Dashboard UI Design Process
This is the checklist we follow on dashboard UI design projects. You can use it with any team, including your own.
- List the users and their questions. Name each role, then write the top five questions that role brings to the screen. Rank them. The top two get the most space.
- Audit the data. For every question, confirm where the data lives, how often it refreshes, and who owns it. If two systems disagree on “active customer,” settle the definition now, not after launch.
- Define each KPI in writing. Write the formula, the time window, the comparison period, and the target. “Revenue” is not a definition; “net revenue after refunds, calendar month, vs same month last year” is.
- Sketch low-fidelity layouts. Use paper or simple wireframes to try two or three arrangements. Test them against the ranked questions before anyone opens a design tool.
- Pick a chart for each widget. Use the table in section 3. If a widget doesn’t map cleanly to one question, cut it or move it to a report.
- Set up design tokens and components. Define colors, type scale, spacing, and reusable components (KPI card, chart container, filter bar, table). This keeps 20 widgets consistent and speeds up development.
- Prototype with real or realistic data. Fake data hides problems like long customer names, negative values, and empty months. Pull a sample of production data, anonymized if needed.
- Run task-based usability tests. Give five or so users from the target role specific tasks (“find the region that missed its target last month”) and watch where they hesitate. Our UX design process guide covers research and testing methods in more detail.
- Check accessibility and performance. Verify contrast, keyboard access, screen reader labels for charts, and that filter interactions stay under the 200 ms INP mark on a mid-range laptop and phone.
- Ship, measure, and revise. Track which widgets get clicked, which filters get used, and which exports run. Remove or demote what nobody touches after a few months.
Pre-launch checklist for your dashboard
Before release, confirm each item below:
- Every widget answers a named user question.
- The top-left area holds the most important metric.
- Every KPI card shows a comparison (period or target), not a bare number.
- No pie chart has more than four or five slices; no chart is 3D.
- Status is shown with color plus an icon or label.
- Chart lines and key graphics meet 3:1 contrast; text meets 4.5:1.
- Empty, loading, error, and partial-data states are designed.
- A “last updated” timestamp is visible.
- Filters persist when users move between pages.
- The layout works at 1366 px wide and on tablet, with a sensible mobile summary.
5. Common Dashboard Design Mistakes to Avoid
Most dashboard UI design problems fall into a few repeat patterns. Here’s what to watch for.
Showing everything because you can
When stakeholders each ask for “their” chart, the dashboard grows to 25 widgets. Nobody reads it. Push back by asking which decision each widget supports, and move the rest to a reports section with search.
Numbers without context
A KPI card that says “1,284 orders” means little on its own. Is that good? Add the comparison (up 12% vs last week) and, where possible, the target. Context turns a number into a judgment the user can act on.
Gauges, pies, and decoration
Speedometer gauges use a lot of space to show one value. Donut charts with eight segments force users to match colors against a legend. Drop shadows, gradients inside bars, and 3D effects add noise. Plain bars and lines almost always do the job better.
Inconsistent filters and time ranges
If one chart shows the last 30 days and the one beside it shows this calendar month, users will compare numbers that aren’t comparable. Use one global date filter, show the active range clearly, and label any widget that deliberately ignores it.
Truncated axes and misleading scales
A bar chart whose y-axis starts at 90 instead of 0 makes a 2% change look like a 50% jump. Bar charts should start at zero. Line charts can use a tighter range, but label the axis so readers know.
Designing with perfect sample data
Mockups filled with neat round numbers and short names look great in a presentation. Then real data arrives with 40-character product names, missing months, and negative refunds. Design with messy data from day one.
Ignoring accessibility
Color-only status dots, low-contrast gridlines, and charts with no text alternative lock out users with low vision or color blindness. Our article on accessible web design and WCAG compliance walks through the fixes; for dashboards, the biggest wins are direct labels, patterns or icons alongside color, and a data table view for every chart.
Forgetting the action
A dashboard that shows a problem but offers no way to act on it sends the user hunting through menus. Link each alert or outlier to the record, report, or workflow where they can fix it.
6. How Golden Info Systems Approaches Dashboard UI Design
Golden Info Systems is a BASIS member software company in Dhaka with 12+ years of experience and 850+ completed projects. Our UI/UX design and UI development services cover user research and analysis, wireframing and prototyping, visual design and branding, technical design, usability testing, and redesign of existing software. The work is done by our in-house team, with no freelancers, and our front-end developers work in React.js, Angular, and Vue.js, so the design and the build stay with the same people.
We run dashboard projects through the same four phases we use for all software work.
Requirements
We interview the people who’ll use the dashboard, by role, and collect their questions. We also review existing reports, spreadsheets, and screens they rely on today. The output is a ranked question list per role and written KPI definitions.
Planning
We audit data sources, agree on refresh rates, and map each question to a widget and chart type. Wireframes and a clickable prototype with realistic data come out of this phase, along with a component and token plan for the visual design.
Execution
Design and development run in short iterations. We build the KPI row and main charts first, test them with real users, and adjust before adding secondary widgets. Accessibility and performance checks happen during the build, not at the end; you’ll find more on the speed side in our guide to Core Web Vitals optimization.
Delivery
We release, monitor usage, and hand over design files, the component library, and documentation. After launch we review which widgets people use and recommend what to change, remove, or add.
If you already have a dashboard that users avoid, a redesign often starts with the Requirements phase alone: a short round of user interviews and a usage review usually shows exactly which parts of the screen are working and which aren’t.
7. Frequently Asked Questions
What is dashboard UI design?
Dashboard UI design is the process of planning and designing a screen that presents key metrics and status information so users can understand a situation quickly and act on it. It covers which metrics to show, the layout and visual hierarchy, chart selection, color and typography, filters and drill-downs, and how the screen behaves while loading, when data is missing, or when something fails. Good dashboard design starts from user questions and treats speed and accessibility as core requirements.
How many KPIs should a dashboard show?
For most dashboards, four to six headline KPIs in the top row is a practical limit, with one or two supporting charts below. Beyond that, users stop reading and start scanning for red. If stakeholders need more metrics, split the screen by role or move secondary metrics to a linked report page. An executive view can be even tighter: three to five numbers, each with a target and a trend, refreshed daily or weekly.
Which chart types work best on a dashboard?
Line charts for trends over time, horizontal bar charts for comparing categories, bullet charts for progress against targets, and KPI cards with a delta and sparkline for single headline numbers. Scatter plots work for relationships between two metrics, and ranked tables with inline bars work well for top and bottom lists. Use pie or donut charts sparingly, with four slices or fewer, and avoid 3D charts and speedometer gauges because they are harder to read accurately.
What is the difference between SaaS and enterprise dashboard design?
SaaS dashboard design serves customers who may use the product a few times a week, so it focuses on showing value quickly, guiding new users with empty states, and driving feature adoption. Enterprise dashboard design serves employees who use the screen daily as part of their job. It needs higher data density, role-based layouts and permissions, data from several internal systems, saved views, exports, and audit trails. Training cost and consistency matter more in enterprise work.
How do you make a dashboard accessible?
Never use color alone to show status; pair it with an icon, label, or pattern, as WCAG 1.4.1 requires. Make sure chart lines and key graphics reach 3:1 contrast against their background and text reaches 4.5:1. Label lines directly instead of relying on a color legend. Provide a data table view or text summary for each chart, support full keyboard access for filters and drill-downs, and give charts meaningful names that screen readers can announce.
How long does it take to design a dashboard?
As an estimate, a focused dashboard with one user role and data that already exists in one system can move from requirements to tested prototype in two to four weeks. Enterprise dashboards with several roles, multiple data sources, and permissions often need six to twelve weeks before development is complete. The biggest time drivers are unclear KPI definitions and messy data, so settling those early saves more time than any design shortcut.
Should a dashboard work on mobile?
Yes, but mobile dashboard UI design should never be a squeezed copy of the desktop screen. On a phone, show the headline KPIs as a vertical stack of cards, keep one main chart, and link to detail views. Operational users such as field managers often check status on mobile, while deep analysis still happens on a laptop. Decide which questions mobile users actually ask, then design a smaller screen that answers just those.
8. Practical Next Step
Before you talk to any designer, write down every role that will use your dashboard and the top five questions each role needs answered, ranked by importance. That one page is the foundation of good dashboard UI design, and it will cut weeks from any project. When the list is ready, send it to our team through the Golden Info Systems contact page and we’ll reply with a recommended layout approach and a scoped estimate for designing and building it.