





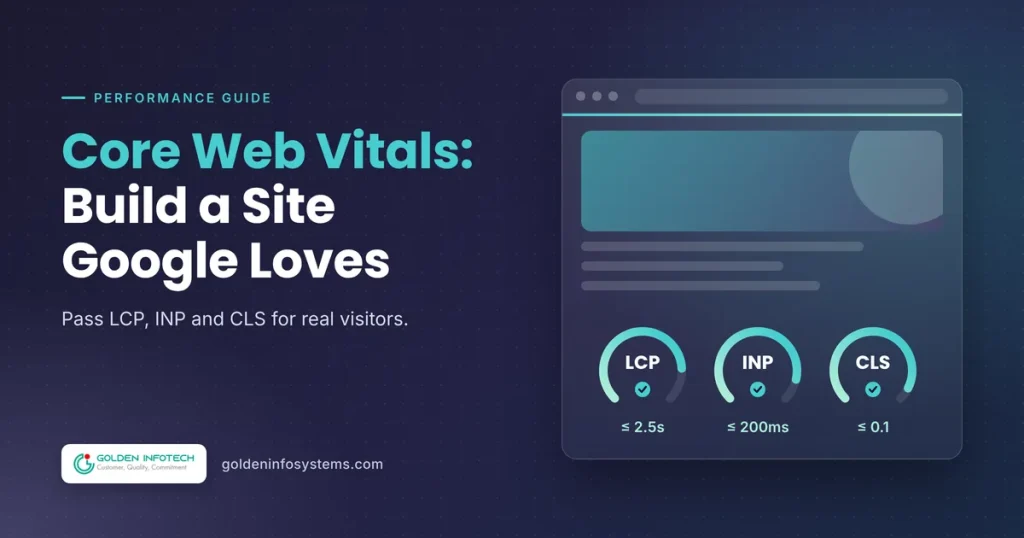
Core Web Vitals optimization means getting three real-user metrics into Google’s “good” range for at least 75% of visits: Largest Contentful Paint (LCP) at 2.5 seconds or less, Interaction to Next Paint (INP) at 200 milliseconds or less, and Cumulative Layout Shift (CLS) at 0.1 or less. Google measures these from real Chrome users on mobile and desktop separately. A fast score on your office laptop proves very little.
Most sites still miss the mark. The HTTP Archive 2025 Web Almanac, working from July 2025 data, found that only 48% of websites had good Core Web Vitals on mobile and 56% on desktop. That leaves a real opening: a well-built site can beat half the web on page experience before you publish a single extra article.
This guide covers what each metric measures, what usually breaks it, how page experience fits into Google rankings, and the build decisions that set your scores long before anyone runs an audit. You’ll also get a fix table, a 10-step process and the mistakes we see most often in website rescue projects.
1. What Core Web Vitals Are and Why Core Web Vitals Optimization Matters
Core Web Vitals are three user-experience metrics that Google defines and publishes on web.dev. Each one targets a different moment of a visit: the first view, the first click and everything that moves on screen in between. Google recommends judging all three at the 75th percentile of page loads, so a few fast visits can’t hide a slow majority.
The three metrics in plain terms
- Largest Contentful Paint (LCP): how long the biggest visible element (usually a hero image, a video poster or a large text block) takes to render. Good is 2.5 seconds or less; poor is anything above 4.0 seconds.
- Interaction to Next Paint (INP): how quickly the page visibly responds after a user taps, clicks or types. Good is 200 ms or less, 200 to 500 ms needs improvement, and anything above 500 ms is poor.
- Cumulative Layout Shift (CLS): how much content jumps around while the page loads. Good is 0.1 or less; poor is above 0.25.
INP is the newest of the three. It replaced First Input Delay (FID) as a Core Web Vital on March 12, 2024, and FID was removed from Google Search Console the same day. The change matters because FID only measured the delay before the browser started handling the first interaction. INP looks at interactions across the whole visit, which is why many JavaScript-heavy sites that passed comfortably in 2023 started failing in 2024.
Field data vs lab data
Google’s verdict on your site comes from the Chrome User Experience Report (CrUX). CrUX data is a 28-day rolling aggregate of real visits, and the API refreshes daily around 04:00 UTC. A fix you ship today therefore takes up to four weeks to fully show in the numbers Google uses.
Lab tools such as Lighthouse run one simulated page load on a throttled device. They’re useful for debugging, because you can repeat them and see exactly what blocked rendering. They don’t count toward your status in Search Console.
There’s a catch for smaller businesses. CrUX only includes pages and origins that are publicly discoverable and “sufficiently popular,” and Google doesn’t publish the traffic threshold. If PageSpeed Insights shows no field data for your site, you need your own real-user monitoring (covered in Step 4 below) to know how actual visitors experience it.
How Core Web Vitals fit the page experience ranking factors
Google’s own Core Web Vitals documentation says it “highly recommend[s] site owners achieve good Core Web Vitals for success with Search,” and that this “aligns with what our core ranking systems seek to reward.” That’s the official position. It is not a promise that passing all three lifts you above a more relevant page.
In practice, Core Web Vitals sit alongside the other page experience ranking factors Google describes: HTTPS, a layout that works on mobile, no intrusive interstitials that block content, and no excessive ads pushing the main content down. Relevance and content quality still decide most rankings. Page experience helps most when two pages are close on relevance, which is exactly the situation on competitive commercial keywords where ten agencies or ten stores are chasing the same query.
What slow pages cost your business
We won’t quote a universal “every second costs X% of sales” figure, because those numbers vary hugely by industry and audience. You can measure your own instead. Send Core Web Vitals from real visits to your analytics tool, then compare conversion rate for sessions with good LCP against sessions with poor LCP on the same landing page. That single report usually settles the budget conversation for Core Web Vitals optimization faster than any industry statistic.
2. Key Factors That Decide Your Core Web Vitals Scores
Each metric has a short list of usual suspects. Fixing them in the right order is most of the work in website speed optimization. Good Core Web Vitals optimization starts with knowing which suspect you’re dealing with on each template.
LCP: server time, the hero element and render-blocking files
Google’s LCP guidance breaks the metric into four parts: time to first byte (TTFB), the delay before the browser starts loading the LCP resource, the time that resource takes to download, and the delay before it actually renders. One of those four is usually much larger than the others, so measure before you change anything.
The common fixes are well known:
- Cut TTFB with full-page caching, a current PHP or Node runtime, and a CDN with an edge location close to your visitors (for a Dhaka audience, that means checking where the nearest edge node really sits).
- Never lazy-load the LCP image. Give it
fetchpriority="high"and serve it in WebP or AVIF with asrcsetso phones don’t download a 2,400 px desktop file. - Inline the small amount of CSS needed for the first screen and defer the rest.
- Preload the one web font used in the hero headline, or use a system font stack for it.
INP: JavaScript fighting for the main thread
Most INP problems come from long tasks: blocks of JavaScript that run for more than 50 ms and stop the browser from responding to a tap. Third-party scripts are frequent offenders. A tag manager that loads analytics, two ad pixels, a chat widget, a heatmap tool and an A/B testing script can easily account for more main-thread time than your own code.
On the code side, look for event handlers that do too much work before the screen updates. Breaking work into smaller chunks with scheduler.yield() (or a setTimeout fallback), debouncing search-as-you-type inputs, and keeping the DOM below a few thousand nodes all help. Heavy client-side hydration in single-page apps is another common cause, which brings us to architecture.
CLS: space you forgot to reserve
web.dev’s CLS guide lists the four usual causes: images or videos without known dimensions, web fonts that render larger or smaller than their fallback, ads or widgets that resize themselves, and content injected above what the user is already reading. Every one of them is preventable at build time.
Set width and height attributes (or CSS aspect-ratio) on every image and video. Give ad slots and embeds a fixed minimum height. Use font-display: swap together with a size-adjusted fallback font so the text doesn’t reflow when the web font arrives. Show cookie banners and promo bars as overlays rather than pushing the page down.
Platform and architecture choices
This is where fast website development starts, and it’s the part most optimization guides skip. Your platform sets the ceiling for your scores.
- WordPress: fast when built with a lean block theme, a small plugin list and real page caching. Slow when a visual page builder, 40 plugins and three “speed” plugins all load their own CSS and JavaScript on every page.
- Shopify and other hosted stores: the theme is usually fine. Apps are the problem, since many inject scripts on every page, including pages where the app does nothing.
- React, Angular or Vue single-page apps: pure client-side rendering delays LCP because the browser must download and run JavaScript before it can show content. Server-side rendering or static generation (Next.js, Nuxt, Angular SSR, Astro) fixes most of that. Our React vs Angular vs Vue comparison covers the rendering options for each.
- Web apps behind a login: Google doesn’t rank pages it can’t crawl, but your users still feel INP on every click. If you’re unsure which category your project falls into, read web application vs website first.
3. Core Web Vitals Fix Table: Causes, Fixes and Effort
Use this table to match a failing metric to its most likely cause. The effort column is our estimate for a typical small or mid-sized business site; your codebase may be faster or slower to change. It’s the quickest way to plan Core Web Vitals optimization work without guessing.
| Metric | Good / Poor threshold | Common cause | First fix to try | Typical effort (estimate) |
|---|---|---|---|---|
| LCP | ≤ 2.5 s / > 4.0 s | Slow server response (high TTFB) | Full-page cache, CDN, current runtime version | Hours to 2 days |
| LCP | ≤ 2.5 s / > 4.0 s | Hero image lazy-loaded or oversized | Remove lazy loading, add fetchpriority, serve WebP/AVIF with srcset | 1 to 4 hours |
| LCP | ≤ 2.5 s / > 4.0 s | Render-blocking CSS and JavaScript | Inline critical CSS, defer non-critical scripts | 1 to 3 days |
| LCP | ≤ 2.5 s / > 4.0 s | Client-side rendered single-page app | Move key pages to SSR or static generation | 1 to 4 weeks |
| INP | ≤ 200 ms / > 500 ms | Third-party tags in a tag manager | Remove unused tags, delay non-essential ones until after load | Hours to 2 days |
| INP | ≤ 200 ms / > 500 ms | Long tasks in event handlers | Split work, yield to the main thread, debounce inputs | 2 to 5 days |
| INP | ≤ 200 ms / > 500 ms | Very large DOM from page builders | Simplify templates, paginate or virtualize long lists | 3 days to 2 weeks |
| CLS | ≤ 0.1 / > 0.25 | Images and embeds without dimensions | Add width and height or aspect-ratio | 1 to 4 hours |
| CLS | ≤ 0.1 / > 0.25 | Banners or ads injected above content | Reserve space or use overlays | Hours to 1 day |
| CLS | ≤ 0.1 / > 0.25 | Web font swap changes text size | Size-adjusted fallback font, preload the main font | 2 to 6 hours |
Optimize the current site or rebuild?
Optimization is the right call far more often than a rebuild. The table below is the rule of thumb we use when a client asks.
| Situation | Optimize existing site | Plan a rebuild |
|---|---|---|
| Failing one metric on a few templates | Yes | No |
| Theme or builder is outdated and unsupported | Short-term only | Yes |
| Client-side SPA with SEO-critical pages | Partial (prerender key pages) | Yes, with SSR or static generation |
| 30+ plugins, many unused | Yes (audit and remove first) | Only if removal breaks core features |
| Redesign already planned within 6 months | Quick wins only | Yes, with performance budgets from day one |
4. Step-by-Step Core Web Vitals Optimization Process
This is the sequence we follow. It works for a 10-page brochure site and for a 50,000-page store; only the time per step changes.
- Pull field data first. Open the Core Web Vitals report in Google Search Console and check mobile and desktop separately. Then run your top landing pages through PageSpeed Insights to see the CrUX numbers for each URL and for the whole origin.
- Group failures by template, not by URL. Search Console groups similar URLs together. A failing product template affects every product, so one template fix can clear hundreds of URLs at once.
- Pick the metric with the worst mobile result. Mobile traffic usually dominates and mobile devices are slower, so fix mobile first.
- Add real-user monitoring. Install Google’s open-source
web-vitalsJavaScript library and send LCP, INP and CLS (with the attribution build, which tells you the element or interaction responsible) to GA4 or your own endpoint. This fills the gap when CrUX has no data for your site. - Reproduce the problem in the lab. Use the Performance panel in Chrome DevTools with CPU throttling set to 4x and network set to a mobile profile. Record a page load for LCP and CLS, then record real clicks for INP.
- Fix server response and caching. Bring TTFB down before touching front-end code, because every other loading step waits for the first byte.
- Fix the LCP element. Identify it in DevTools, make sure it’s in the initial HTML, prioritize it, compress it and size it correctly for each breakpoint.
- Reserve space for everything that loads late. Images, ads, embeds, consent banners and fonts. Rerun the trace and confirm the layout shift entries are gone.
- Cut and defer JavaScript. List every third-party script with its owner and business purpose. Remove what nobody can justify, then delay the rest until after the first interaction or after load.
- Validate and guard the result. Click “Validate fix” in Search Console and expect the validation to take around 28 days because of the rolling CrUX window. Add Lighthouse CI to your deployment pipeline with a performance budget so a future plugin or tag can’t quietly undo the work.
Pre-launch checklist for new builds
If you’re building a new site, bake website speed optimization into the brief instead of auditing it afterward:
- A written performance budget (for example, as a starting point: under 170 KB of compressed JavaScript on the homepage, hero image under 150 KB, no more than two font files).
- Server-side rendering or static output for every page that needs to rank.
- Image dimensions and modern formats handled automatically by the CMS or build pipeline.
- A third-party script policy: who approves new tags and how they load.
- A staging test on a mid-range Android phone, not only on the developer’s laptop.
- Real-user monitoring live on launch day, so you have baseline data before CrUX has any.
Fast website development comes down to these early decisions. Retrofitting them later means reopening templates that are already live, retesting every page type and waiting another 28 days for field data to confirm the result.
5. Common Mistakes to Avoid
These mistakes waste more Core Web Vitals optimization budget than anything else we see when businesses bring us a site for a speed rescue.
Chasing a perfect Lighthouse score. A 100 in Lighthouse is a lab result from one simulated load. Google’s ranking signal uses field data. We’ve seen sites score 95 in the lab and still fail INP for real users because the lab test never clicks anything.
Testing on fast hardware only. Your developer’s MacBook on office fiber is not your customer’s three-year-old Android phone on mobile data. Throttle your tests or use real devices.
Lazy-loading everything, including the hero. Lazy loading is good for images below the fold. Applied to the LCP image, it delays the one element Google measures for loading speed.
Stacking optimization plugins. Two caching plugins plus a minification plugin plus a “lazy load everything” plugin often conflict, break layouts or double-process files. One well-configured tool beats three overlapping ones.
Ignoring the tag manager. Marketing teams add tags for campaigns and rarely remove them. An annual tag audit often recovers more INP than a week of code refactoring.
Fixing only the homepage. Google assesses groups of similar pages. Your product, category, service and blog templates usually carry far more traffic than the homepage.
Expecting overnight results. Because of the 28-day CrUX window, a fix shipped on the 1st won’t be fully reflected until near the end of the month. Track your own real-user data in the meantime.
Treating Core Web Vitals optimization as a one-time project. Every new feature, plugin, font and tracking script adds weight. Without a budget in your deployment pipeline, scores drift back within months.
6. How Golden Info Systems Approaches Core Web Vitals Optimization
At Golden Info Systems, we treat page speed as part of the build from the first brief. We’ve worked in software and web development for 12+ years and have completed 850+ projects. We’re a BASIS member company in Dhaka with a 100% in-house team, so the developers who audit your site are the same people who fix it.
We handle Core Web Vitals optimization from two directions:
- Our web development team builds new sites and web applications with performance budgets set in the brief, and runs Website Rescue and Optimization projects for existing sites that fail LCP, INP or CLS. We work across CMS-based websites, e-commerce applications and custom web apps, with front ends in React.js, Angular and Vue.js and back ends including Python and CodeIgniter.
- Our digital marketing and SEO team covers technical SEO, which includes indexation, schema and Core Web Vitals, so speed fixes are tied to the pages that actually bring in search traffic and leads.
Every engagement follows our four-phase process:
- Requirements: we pull your Search Console and CrUX data, list failing templates and agree on which pages matter most to revenue.
- Planning: we trace each failure to its cause, estimate effort per fix and decide what to optimize now and what belongs in a rebuild.
- Execution: we ship fixes in priority order on staging, verify them with lab traces and real-user data, then deploy.
- Delivery: we hand over a before-and-after report, set up monitoring and a performance budget, and track the 28-day field data until Search Console confirms the fix.
7. Frequently Asked Questions
What are Core Web Vitals in simple terms?
Core Web Vitals are three measurements Google uses to judge how a page feels to real visitors. LCP measures how fast the main content appears, INP measures how quickly the page responds when someone taps or clicks, and CLS measures how much the layout jumps while loading. Google collects them from real Chrome users and judges each at the 75th percentile, so most of your visitors need a good experience for the page to pass.
Do Core Web Vitals affect Google rankings?
Yes, as part of Google’s page experience signals, but they’re not the main factor. Google says good Core Web Vitals align with what its core ranking systems reward, while relevance and content quality still decide most results. Where they matter most is in close competition: if your page and a rival’s are similarly relevant, the better experience can tip the result. They also affect bounce and conversion rates, which matter regardless of rank.
What is a good INP score?
A good INP score is 200 milliseconds or less at the 75th percentile of real visits. Between 200 and 500 ms needs improvement, and above 500 ms is poor. INP replaced First Input Delay as a Core Web Vital on March 12, 2024. Because INP covers every interaction during a visit, sites with heavy JavaScript, large tag managers or complex page builders often fail it even when their loading speed looks fine.
Why does PageSpeed Insights show different results from Search Console?
PageSpeed Insights shows two kinds of data: field data from CrUX at the top and a Lighthouse lab test below it. Search Console uses only field data, grouped across similar URLs. The lab score comes from one simulated load on a throttled device, so it can be better or worse than what real visitors experience. When the two disagree, trust the field data for SEO and use the lab report to find causes.
How long does it take for Core Web Vitals fixes to show up?
Expect up to about four weeks. CrUX data is a 28-day rolling aggregate that updates daily, so a fix shipped today is blended with three weeks of older visits for a while. Search Console’s “Validate fix” process follows the same window. If you run your own real-user monitoring with the web-vitals library, you’ll see the improvement in your own data within days, long before Google’s report catches up.
Can a WordPress website pass Core Web Vitals?
Yes. WordPress itself isn’t the problem; heavy themes, page builders and plugin overload usually are. A lean block theme, a short plugin list, proper page caching, a CDN, optimized images with set dimensions and a controlled list of third-party scripts will get most WordPress sites into the good range on all three metrics. Sites built on older multipurpose themes sometimes need a theme rebuild rather than more plugins.
Is a website speed test score of 100 necessary?
No. A Lighthouse score of 100 is a lab result, and Google doesn’t use the Lighthouse score for ranking. What counts is whether real visitors get good LCP, INP and CLS at the 75th percentile. Many sites rank and convert well with lab scores in the 70s or 80s because their field data passes. Spend your effort on the metric that fails in field data, not on the last few lab points.
8. Practical Next Step
Open Google Search Console today, go to the Core Web Vitals report, and write down which metric fails on mobile and which URL groups it affects. That list is the brief for your Core Web Vitals optimization work. Then send it to our team with your platform and top five landing pages, and we’ll tell you which fixes come first and what each one involves.